A reproducible audit of the taxable-wealth gap and who actually bears the assessed tax
The Null Institute | Independent Research Note | 17 November 2026
By Ilya Nikitin, Ph.D. | Independent analysis of public Statistics Norway data; not peer-reviewed.
A Norwegian-style wealth tax is often introduced to Americans by its headline rate: up to 1.1% of taxable net wealth. But that is not a rate on the market value of everything households own. How far apart are those two quantities in Norway itself, and has the gap changed?
We recalculated six years of official Statistics Norway household wealth and tax records, using the same table and household definitions throughout. The result is unusually clear: between 2021 and 2024, recorded annual wealth-tax assessments rose 72.8% while estimated household net wealth rose 11.5%. The aggregate tax-to-wealth ratio consequently climbed from 0.196% to 0.303%, a 55.0% relative increase. Yet the wealthiest quarter of households accounted for 98.2% to 98.8% of assessments in every year from 2019 through 2024.
That is an accounting observation, not an estimate of the effects caused by a particular tax reform. It is relevant to US projections because it shows how much a nominal rate can conceal about the tax base and the distribution of liabilities.
What the six-year data show
Statistics Norway’s StatBank table 14975 reports estimated net wealth and assessed wealth tax (formuesskatt) by household wealth quartile. We extracted the all households category, all income groups, wealth groups 0 through 4, total amounts in NOK million, and years 2019 to 2024. We used the official machine-readable API, not values reconstructed from a chart.
| Year | Household net wealth (NOK tn) |
Assessed wealth tax (NOK bn) |
Tax / wealth | Top quarter: share of wealth | Top quarter: share of tax |
|---|---|---|---|---|---|
| 2019 | 7.296 | 16.114 | 0.221% | 77.65% | 98.83% |
| 2020 | 7.924 | 16.739 | 0.211% | 77.43% | 98.66% |
| 2021 | 9.134 | 17.866 | 0.196% | 76.25% | 98.21% |
| 2022 | 9.616 | 25.560 | 0.266% | 75.37% | 98.65% |
| 2023 | 9.670 | 28.502 | 0.295% | 75.79% | 98.64% |
| 2024 | 10.181 | 30.874 | 0.303% | 75.95% | 98.51% |
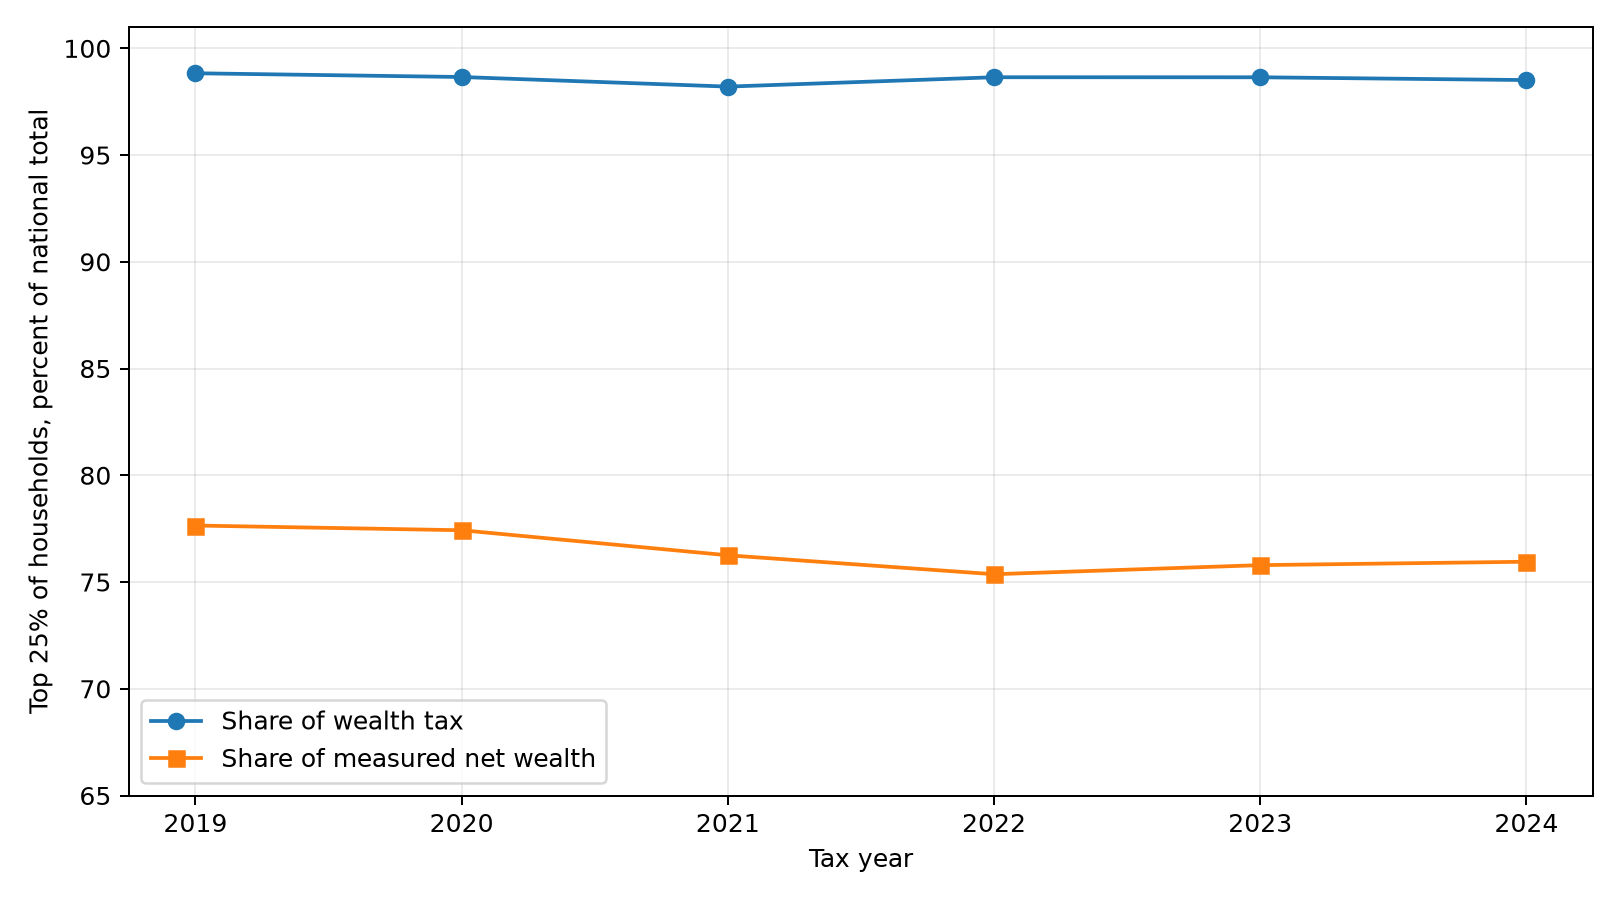
The pattern has two distinct parts. First, from 2021 to 2024, annual assessments increased much faster than the market/estimated-sale value of household net wealth. Second, their distribution remained extraordinarily concentrated. Even as the wealthiest quarter’s share of net wealth drifted from 77.65% in 2019 to 75.95% in 2024, that group’s share of the assessed wealth tax stayed above 98%.
The 2024 figures can be checked directly. The measured household net-wealth stock was NOK 10,180,589.5 million, while assessed wealth tax was NOK 30,873.6 million:
Our check: 30,873.6 / 10,180,589.5 × 100 = 0.3033%.
Of that, the highest wealth quartile held NOK 7,732,232.5 million in net wealth and had NOK 30,414.9 million in wealth-tax liability. Its share of tax was 98.51%, against 75.95% of wealth. Within the top quartile, assessed tax was 0.393% of estimated net wealth. These are ratios between annual assessed tax and an aggregate stock of wealth, not the tax rates faced by a typical person or an individual billionaire.
Tax burden changed; its concentration barely did
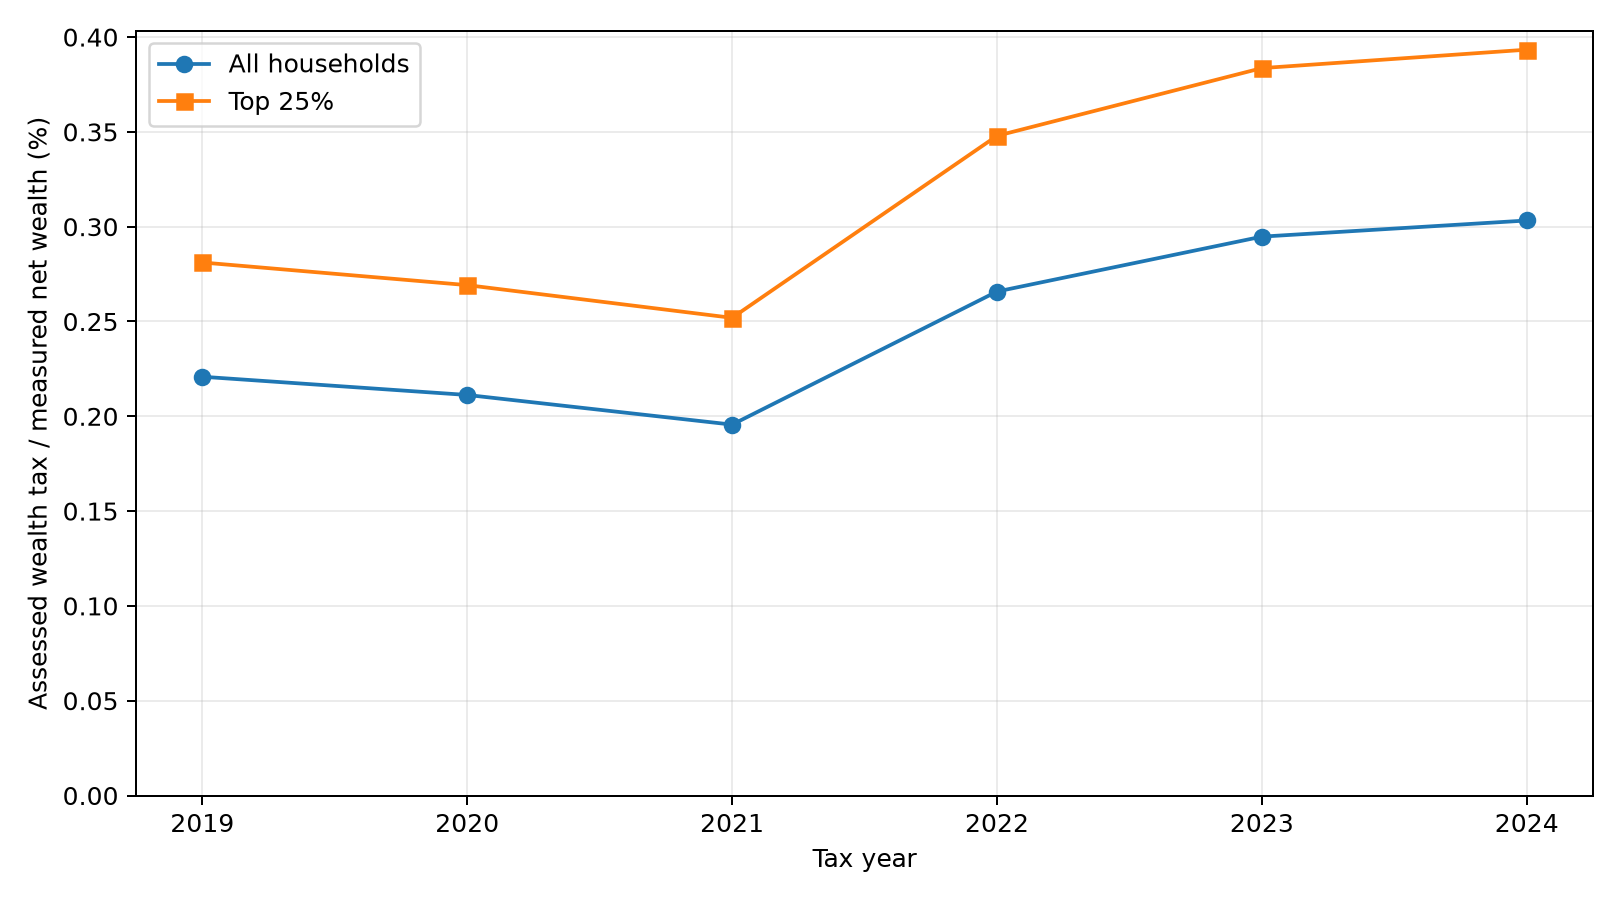
The reform timing is important context, but does not establish causation. Norway’s ordinary statutory rate was 0.85% during 2019-2021. In 2022 it rose to 0.95%, with a new 1.1% upper bracket. In 2023 the lower taxable-wealth rate became 1.0%; the top bracket remained 1.1%. Valuation discounts, especially for corporate equity, also changed.
Our calculated aggregate ratio was 0.196% in 2021, 0.266% in 2022, 0.295% in 2023 and 0.303% in 2024. The timing is compatible with a higher effective burden after the reforms, but does not measure how much of the rise was caused by tax rates, asset revaluation, wealth growth, shifting holdings, immigration or other behavior.
Nor is the concentration of the tax an entirely new finding. An earlier Statistics Norway working paper found that the highest wealth decile accounted for about 93% of wealth-tax payments in 2018. Our added result is a transparently computed, subsequent six-year series pairing each year’s tax concentration with its share of measured wealth and the aggregate tax-to-wealth ratio. A decile in the older study is not directly comparable to a quartile in our series.
What this changes for the American debate
A US wealth-tax estimate needs a defined population, an assessed tax base, a threshold, tax units, and asset-specific valuation rules. Multiplying 1.1% by a gross list of billionaire wealth, or 1% by all US household net worth, is a useful rough arithmetic check, not a forecast of money collected.
A Fortune reporting request mentions possible US receipts of approximately $92 billion from billionaires and $1.8 trillion from a broader tax. We have not identified or verified the models behind either number. The six-year Norwegian record therefore neither disproves nor validates those amounts.
It does provide a concrete audit question for anyone promoting them: Where in the estimate is the adjustment from measured wealth to assessed, taxable wealth, and how is that adjustment distributed across wealth groups? Norway’s experience makes it clear that a ratio taken from all households cannot simply be transferred to billionaires. Conversely, applying Norway’s 0.303% nationwide aggregate ratio to the United States would also be unjustified. US wealth composition, tax exemptions, housing, private-company valuations, taxpayer units and potential avoidance are different.
The useful takeaway is not that the US should expect a specific fraction of Norway’s tax receipts. It is that even in the country being used as the example, a change in nominal policy can coincide with a substantial change in assessed tax relative to wealth without much change in which part of the population accounts for the liability.
Definitions, method and limits
This research note calculates assessed personal net-wealth tax as recorded for households divided by estimated household net wealth. It does not calculate government cash collections, tax as a percentage of income, taxable asset values, or the average effective tax rate among people who owe tax.
The household wealth concept excludes pension wealth; the reported assets are largely estimated market/assumed-sale values before wealth-tax valuation discounts. Student households are excluded. Households are re-ranked into wealth quartiles each year, so this is a sequence of cross-sections rather than a fixed cohort tracked through time. The lowest quartile has negative aggregate net wealth, which is why its own tax-to-net-wealth ratio would be misleading.
All amounts in the source data are in NOK million and refer to the same tax year. No exchange rates, inflation assumptions, sampling weights or statistical models were introduced. The four quartile totals reconcile with the all-household totals within the published 0.1-million-NOK rounding tolerance in all six years. The 2024 annual totals separately reconcile with the main SSB household statistics. Ratios are calculated from unrounded published table values, then rounded only for display.
The data cannot show which asset-specific valuation rule explains what share of the gap. The underlying household microdata, tax-unit level rules and asset eligibility would be needed for a causal decomposition or a credible US revenue forecast.
Reproduce the calculation
For each year t, define W(t) as all households’ estimated net wealth and T(t) as their assessed wealth tax, both in NOK million. Let WQ(t) and TQ(t) denote the same aggregates for the highest wealth quartile.
– Aggregate tax-to-wealth ratio: 100 × T(t) / W(t).
– Highest quartile’s share of tax: 100 × TQ(t) / T(t).
– Highest quartile’s share of wealth: 100 × WQ(t) / W(t).
– Change in the aggregate ratio, 2021 to 2024: 100 × ((T(2024)/W(2024))/(T(2021)/W(2021)) − 1) = 55.04%.
Reproducibility: Download the exact official six-year SSB CSV extract. The independently checked source file, code, year-by-year calculations and figures are archived by The Null Institute; download the public reproducibility package (Python, original CSV, results, figures and SHA-256 manifest).
Primary data: Statistics Norway, StatBank table 14975, https://www.ssb.no/en/statbank/table/14975 (2019–2024 extract, accessed 17 November 2026; SSB published table updated 11 November 2026).
Source definitions and independent 2024 cross-check: https://www.ssb.no/en/inntekt-og-forbruk/inntekt-og-formue/statistikk/inntekts-og-formuesstatistikk-for-husholdninger
Statutory history: Norwegian government budget documentation and OECD Tax Policy Reforms 2022/2023, https://www.oecd.org/en/publications/tax-policy-reforms-2022_067c593d-en/full-report/component-6.html and https://www.oecd.org/en/publications/tax-policy-reforms-2023_d8bc45d9-en/full-report/component-5.html
Prior evidence: Statistics Norway, A wealth tax at work (2021), Figure 6 and section 4, https://www.ssb.no/en/inntekt-og-forbruk/skatt-for-personer/artikler/a-wealth-tax-at-work/_/attachment/inline/1d73d3a5-436d-45c2-9661-a44b45b0d460%3A2bcbf3a8f2e34e68f1aedd51b52b670b45fc6571/DP960_web.pdf