A reproducible reanalysis of four LightLab measurement reports
The Null Institute | Independent Research Note | Published 19 November 2026
By Ilya Nikitin, Ph.D. | Reanalysis of published laboratory data; no new optical measurements; not peer reviewed.
A simple distance rule says that if you move twice as far from a light source, irradiance falls to one-quarter. For a point-like source under suitable conditions, that works. But how badly does the shortcut perform when the source is a nearby panel containing hundreds of LEDs?
We recalculated published irradiance measurements for four PlatinumLED BIOMAX panels and tested the shortcut against them. At 24 inches, a point-source extrapolation calibrated to each panel’s six-inch measurement produced values 7.9 to 10.1 times lower than the laboratory’s reported measurements. We also reconstructed four reported laboratory averages from 196 individual readings, showing that the underlying arithmetic is internally consistent.
Neither finding is a new optical measurement or a test of clinical efficacy. It is an independent, reproducible check on what the published numbers do, and do not, support.
The test
LightLab International Allentown measured BIOMAX 300, 450, 600 and 900 panels at 6, 12, 18 and 24 inches. At each distance, a 7 × 7 grid covered the same central 6 × 6 inch test area. The reports give area-average irradiance in mW/cm² over 350–1,700 nm, a range that includes more than red and near-infrared light.
We used the six-inch reported area average as a reference, then calculated what a point-source inverse-square shortcut would predict at other distances:
Predicted irradiance at distance d = measured irradiance at 6 in × (6/d)².
This is a deliberately simplified comparison, not a calibrated model of the panel’s optical geometry. In particular, the distance is measured from the panel, not from a fitted effective point-source origin.
Result: up to a tenfold difference at 24 inches
| Panel | Measured at 6 in | Measured at 12 in | Measured at 24 in | Point-source prediction at 24 in | Measured / predicted at 24 in |
|---|---|---|---|---|---|
| BIOMAX 300 | 71.79 | 56.25 | 35.30 | 4.49 | 7.87× |
| BIOMAX 450 | 79.79 | 67.67 | 44.73 | 4.99 | 8.97× |
| BIOMAX 600 | 84.30 | 66.00 | 45.18 | 5.27 | 8.58× |
| BIOMAX 900 | 83.13 | 71.29 | 52.35 | 5.20 | 10.08× |
Table 1. Area-averaged irradiance (mW/cm²), 350–1,700 nm, over the fixed central test area. “Predicted” is our normalised point-source extrapolation, not a manufacturer claim. Original measurements: LightLab reports LLIA002684-001 to -004.
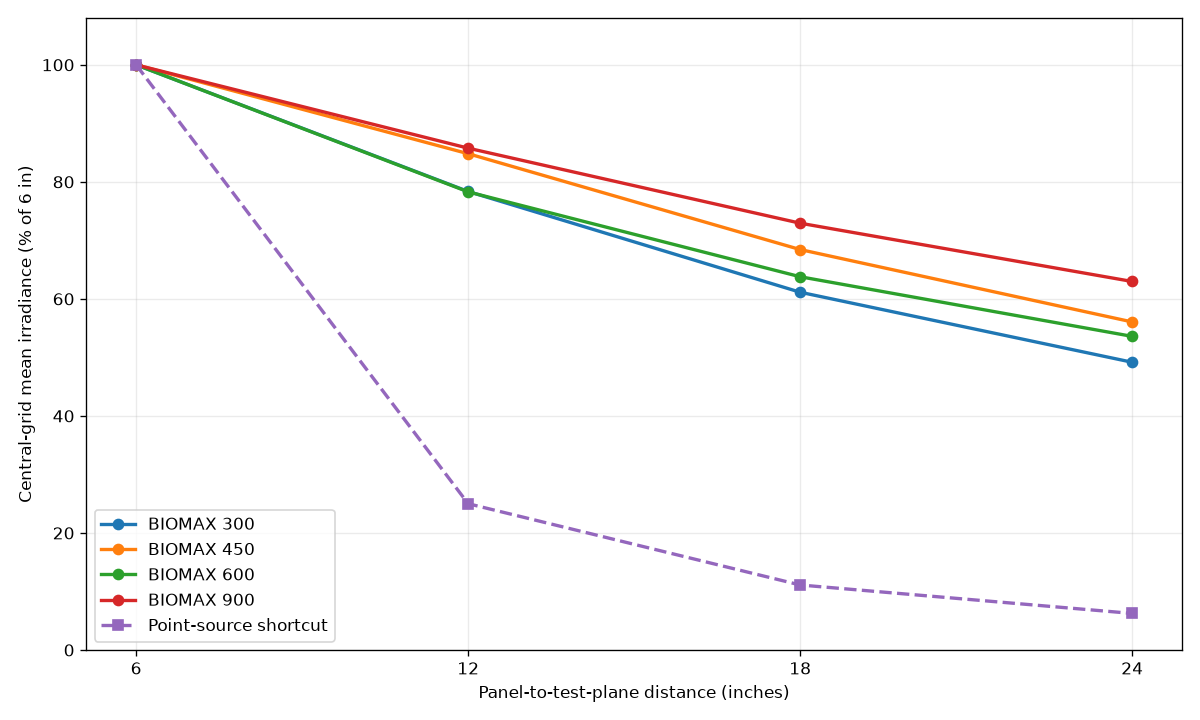
At twelve inches, the four measured averages had declined by 14.2–21.7%, compared with the shortcut’s predicted 75% decline. The measured-to-predicted ratios were already 3.13–3.43×. At 24 inches they rose to 7.87–10.08×. The full 16 report observations and calculations are included in the accompanying data file.
For BIOMAX 900, consider a purely illustrative five-minute exposure at the 24-inch area-average irradiance. Using the reported 52.35 mW/cm² gives 15.71 J/cm² of nominal incident exposure. The point-source extrapolation gives 5.20 mW/cm², or 1.56 J/cm² over the same time. Neither is a treatment recommendation, and an area average is not a dose measurement at every point on the body.
The result does not refute the inverse-square law. A panel is an extended, directional array, and the measurements were taken in its near field. The finding quantifies the mismatch created by replacing that geometry with an uncalibrated point-source shortcut.
A second check: what does “average” mean?
The BIOMAX 900 report publishes 49 individual total-irradiance measurements at each distance. We transcribed all 196 readings and tried to reproduce its four reported averages.
Simply averaging the 49 readings did not reproduce the published numbers. A two-dimensional trapezoidal integration over the square grid did. Interior points receive full weight, edge points half weight and corners quarter weight, with weights summing to 36 for the one-inch grid.
| Distance | Our reconstructed area average | LightLab reported average |
|---|---|---|
| 6 in | 83.1342 | 83.13 |
| 12 in | 71.2923 | 71.29 |
| 18 in | 60.6306 | 60.63 |
| 24 in | 52.3501 | 52.35 |
Table 2. Independent numerical reconstruction from the BIOMAX 900 measurement grid; units mW/cm².
The figures match the reports to two decimal places at every distance. This identifies an averaging procedure consistent with the published data; it does not prove which algorithm the laboratory actually used, or independently validate its instrument calibration. It is a reproducibility check on the numerical reporting.
Another boundary: exposure is not a single number everywhere
At six inches, the BIOMAX 900 grid ranged from 57.52 to 112.19 mW/cm², nearly a twofold difference within the measured area. At 24 inches, that range narrowed to 44.02–56.98 mW/cm². For this grid, increasing distance reduced the mean but made the central field more uniform.
The spectrum was not spatially invariant either: between six and 24 inches, the report’s 600–700 nm mean fell by 53.7%, versus 18.5% for 780–1,700 nm. That is a property of these reported optical measurements, not evidence that one treatment wavelength works better than another.
What this does, and does not, establish
Established from the published data: a simple point-source extrapolation substantially underestimates the central-area averages reported for these four panels at 12–24 inches; the four BIOMAX 900 averages are reproducible from its raw grid using area-weighted integration.
Not established: the actual dose absorbed in tissue, the performance of unrelated devices, whether any manufacturer uses this shortcut, or the safety or effectiveness of a treatment schedule. All four panels come from one product family and the same laboratory. We did not measure the hardware independently. The fixed central test area cannot be assumed to represent the entire beam or a curved body surface.
This is why an irradiance number without its measurement distance, spatial definition and wavelength range is a poor basis for comparing devices or calculating incident exposure. Even a correctly calculated surface exposure cannot, by itself, predict a clinical response.
Data, method and source reports
Reproducibility package: the four-panel, 16-observation summary, all 196 transcribed BIOMAX 900 readings, source-linked comparison tables, Python calculation, chart and file hashes. Download the reproducibility package (ZIP). Original test data are attributed to LightLab; calculations and comparisons are by The Null Institute.
- LightLab, BIOMAX 300, LLIA002684-001: Source report
- LightLab, BIOMAX 450, LLIA002684-002: Source report
- LightLab, BIOMAX 600, LLIA002684-003: Source report
- LightLab, BIOMAX 900, LLIA002684-004: Source report