The Null Institute | Independent Research Note | 15 November 2026
By Ilya Nikitin, Ph.D. | Independent analysis of public FDIC data; not peer-reviewed.
The U.S. banking industry reported an annualized return on assets (ROA) of 1.37% in the second quarter of 2026, with $90.1 billion in net income. But what does “strong capital” actually tell us about banks whose earnings and loan quality are getting worse?
We tested 4,230 FDIC-insured institutions that appeared in both the second-quarter 2025 and second-quarter 2026 institution-level datasets. We defined a joint deterioration as a fall of at least 0.5 percentage points in reported ROA alongside a rise of at least 0.5 percentage points in the noncurrent-loan ratio over the same year. These are transparent analytical cutoffs, not regulator-designated troubled-bank statuses.
Our finding: Under a 12% total risk-based capital threshold, joint deterioration occurred in 44 of 2,265 higher-capital banks (1.94%), versus 11 of 173 below the threshold (6.36%). But using a 10% Tier 1 leverage threshold on the much more complete sample, the difference nearly vanished: 68 of 2,893 above it (2.35%), versus 30 of 1,337 below it (2.24%). “Strong capital” is not a single measurement, and a bank-level stress comparison can change substantially with the chosen measure and cutoff.
What the numbers show
| Definition of higher capital | Above threshold: joint deterioration | Below threshold: joint deterioration |
|---|---|---|
| Total risk-based capital ratio ≥12% | 44 / 2,265 = 1.94% | 11 / 173 = 6.36% |
| Tier 1 leverage ratio ≥10% | 68 / 2,893 = 2.35% | 30 / 1,337 = 2.24% |
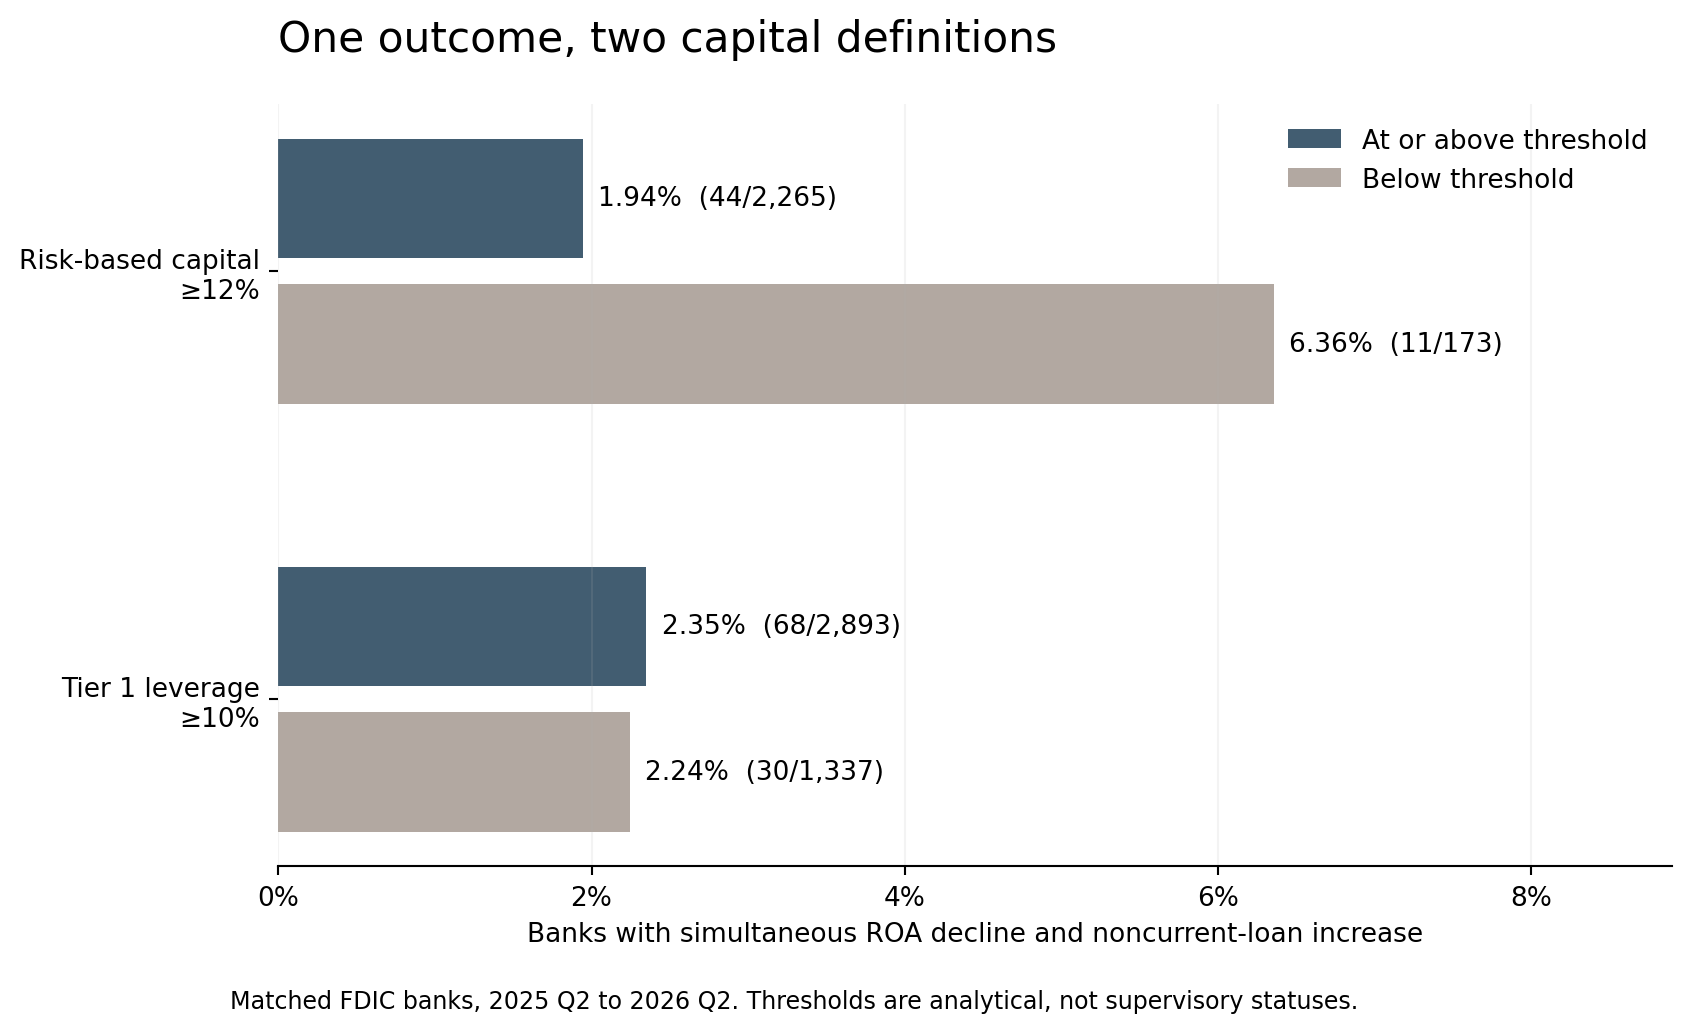
The ratios are not economically interchangeable. Risk-based capital uses risk-weighted assets; leverage capital is measured against a different denominator. The 12% threshold was specified before the main analysis; the 10% leverage split is an exploratory comparison chosen to provide a usable comparator group. Neither threshold is a bank’s formal supervisory capital classification.
To check whether the risk-based comparison simply reflected different bank sizes, we stratified the matched panel into institutions with assets below $1 billion, $1–10 billion, $10–100 billion, and at least $100 billion. The combined odds ratio for the high-capital group was 0.285 (95% interval 0.144–0.565) for the joint-deterioration indicator. For the 10% leverage comparison, the size-stratified odds ratio was 1.000 (95% interval 0.646–1.548). These intervals quantify model-based uncertainty under the comparison framework; the observed bank counts themselves are a census of included institutions. Neither comparison establishes that capital causes or prevents deterioration.
One seemingly small decision changes the risk-based result markedly. Raise the dividing line from 12% to 14%, and the rates are 36 / 1,720 (2.09%) above versus 19 / 718 (2.65%) below. A simple headline about the “protective” association of strong bank capital would conceal that threshold sensitivity.
An important denominator problem
The 2026Q2 BankFind extract contains 4,238 FDIC-insured institutions, consistent with the FDIC’s industry profile. In 1,798 institutions (42.4%), the total risk-based capital field is zero. These banks account for only 3.52% of combined reported industry assets, but they are too numerous to ignore when talking about the typical bank. We treated zero as an unusable capital observation, not as proof of inadequate capital. The precise reporting reason was not established by this study.
An earlier version of our calculation also excluded risk-based capital ratios above 100%. We reviewed this rule: some specialized banks have very high positive ratios because the risk-weighted denominator can be small. Rather than automatically discarding those reports, this update includes all positive ratios. In the 2025–2026 matched sample, that brings 24 additional positive-ratio banks into the risk-based comparison and changes the joint-deterioration tally for the ≥12% group from 43/2,241 to 44/2,265. The interpretation does not reverse, but the correction matters for reproducibility.
Why this matters
The FDIC’s industry results describe the condition of the banking sector overall. Our bank-by-bank calculation asks a different question: how many institutions meet an explicitly defined combination of falling profitability and rising noncurrent loans, and how strongly does the answer depend on which capital ratio is used? We find a relatively small affected minority and considerable measurement sensitivity. This is a warning against treating any single “capital strength” number as a direct test of earnings or credit resilience, not evidence of a concealed system-wide banking crisis.
The same analysis finds weak profitability (ROA below 0.5% in 2026Q2) at 280 of 2,265 (12.36%) banks above the 12% risk-capital threshold and 35 of 173 (20.23%) below it. Weak earnings and deteriorating earnings-plus-credit are distinct outcomes: a bank can be unprofitable without experiencing the specific simultaneous change used in our test.
Method and limits
Source. FDIC BankFind Suite institution-level financials, fetched 15 November 2026 for 2025Q2 and 2026Q2; source archive contains 2024Q2 and 2026Q1 as well. We removed the BankFind BKCLASS=NC and BKCLASS=OI categories to align with the published FDIC-insured universe, producing 4,421 observations in 2025Q2 and 4,238 in 2026Q2. We matched bank certificates (CERT), giving 4,230 overlapping institutions. This excludes 191 2025-only certificates and eight 2026-only certificates; acquisitions, closures and changes in coverage may therefore affect the panel.
Variables. RBCRWAJ: total risk-based capital ratio; RBC1AAJ: Tier 1 leverage ratio; ROA: reported annualized return on assets; NCLNLSR: noncurrent-loan ratio; ASSET: total assets in thousands of U.S. dollars. All ratio changes are stated in percentage points. The analysis counts banks equally, except the stated asset-share calculation. No imputation was performed. Risk-based analyses require positive reported RBCRWAJ; leverage analyses require positive RBC1AAJ; outcomes require valid year-pair values and noncurrent-loan ratios between 0% and 100%.
Sensitivity. The 12% risk-capital cutoff is not magic: raising it to 14% attenuates the contrast. At a 10% leverage cutoff the joint-deterioration outcome is nearly equally common on either side; results differ at other leverage cutoffs. The below-12% risk-capital group contains only 173 banks, with 11 joint deteriorations, making its estimated frequency sensitive to a few institutions. Our year-end exposure may be a consequence, not merely a predictor, of recent profit and credit trends. Specialized trust banks, extreme ratios, and bank mergers can complicate comparison. Bank returns may be year-to-date annualized rather than isolated second-quarter income. Because this is an exploratory observational comparison, the calculated odds ratios are not causal estimates or a prediction of future failures.
Outside scope. These bank-level data do not identify exposures to AI infrastructure borrowers. They cannot answer how an AI-capex shortfall would propagate through banks, bond markets or private credit. A separate borrower- and security-level exposure map would be needed.
Reproduce the result
We provide the original FDIC CSV archive with a SHA-256 manifest, a Python script for the full calculation, independent counts using standard-library CSV parsing, detailed size-stratified tables, a JSON result file and a figure. The independent script reproduces all four key numerator/denominator pairs above. Data are from the FDIC, while the threshold comparisons, matched-bank calculations and interpretation are The Null Institute’s work.
Download code, FDIC source snapshots and reproducibility files: Download the reproducibility package (ZIP, 1.52 MB)
FDIC BankFind API: https://api.fdic.gov/banks/docs/
FDIC Q2 2026 industry figures: https://content.govdelivery.com/accounts/USFDIC/bulletins/426aa10
Editorial note: this is independent secondary analysis of public regulatory data. It is not investment advice and does not label any identified bank as unsafe.